Labarthe-Rivière
This article has multiple issues. Please help improve it or discuss these issues on the talk page. (Learn how and when to remove these template messages)
|
Labarthe-Rivière | |
|---|---|
 The town hall in Labarthe-Rivière | |
.svg?lang=en) Coat of arms | |
Location of Labarthe-Rivière  | |
 Labarthe-Rivière  Labarthe-Rivière | |
| Coordinates: 43°04′52″N 0°40′22″E / 43.0811°N 0.6728°E | |
| Country | France |
| Region | Occitania |
| Department | Haute-Garonne |
| Arrondissement | Saint-Gaudens |
| Canton | Saint-Gaudens |
| Government | |
| • Mayor (2020–2026) | Claire Vougny[1] |
| Area 1 | 13.65 km2 (5.27 sq mi) |
| Population (2021)[2] | 1,295 |
| • Density | 95/km2 (250/sq mi) |
| Time zone | UTC+01:00 (CET) |
| • Summer (DST) | UTC+02:00 (CEST) |
| INSEE/Postal code | 31247 /31800 |
| Elevation | 373–710 m (1,224–2,329 ft) (avg. 394 m or 1,293 ft) |
| 1 French Land Register data, which excludes lakes, ponds, glaciers > 1 km2 (0.386 sq mi or 247 acres) and river estuaries. | |
Labarthe-Rivière (French pronunciation: [labaʁt ʁivjɛʁ]; Occitan: Era Barta d'Arribèra) is a commune in the Haute-Garonne department in southwestern France.
Geography
[edit]Climate
[edit]Labarthe-Rivière has an oceanic climate (Köppen climate classification Cfb). The average annual temperature in Labarthe-Rivière is 11.7 °C (53.1 °F). The average annual rainfall is 745.9 mm (29.37 in) with May as the wettest month. The temperatures are highest on average in August, at around 19.9 °C (67.8 °F), and lowest in January, at around 4.1 °C (39.4 °F). The highest temperature ever recorded in Labarthe-Rivière was 40.0 °C (104.0 °F) on 30 July 1983; the coldest temperature ever recorded was −19.0 °C (−2.2 °F) on 9 January 1985.
| Climate data for Labarthe-Rivière (1981−2010 normals, extremes 1975−2000) | |||||||||||||
|---|---|---|---|---|---|---|---|---|---|---|---|---|---|
| Month | Jan | Feb | Mar | Apr | May | Jun | Jul | Aug | Sep | Oct | Nov | Dec | Year |
| Record high °C (°F) | 20.0 (68.0) |
24.0 (75.2) |
27.0 (80.6) |
26.5 (79.7) |
31.5 (88.7) |
36.0 (96.8) |
40.0 (104.0) |
38.0 (100.4) |
36.0 (96.8) |
29.5 (85.1) |
24.0 (75.2) |
25.5 (77.9) |
40.0 (104.0) |
| Mean daily maximum °C (°F) | 9.5 (49.1) |
11.1 (52.0) |
13.9 (57.0) |
15.7 (60.3) |
19.9 (67.8) |
22.9 (73.2) |
25.9 (78.6) |
26.1 (79.0) |
23.2 (73.8) |
18.5 (65.3) |
13.3 (55.9) |
10.4 (50.7) |
17.6 (63.7) |
| Daily mean °C (°F) | 4.1 (39.4) |
5.4 (41.7) |
7.9 (46.2) |
9.7 (49.5) |
14.0 (57.2) |
17.2 (63.0) |
19.7 (67.5) |
19.9 (67.8) |
16.7 (62.1) |
12.4 (54.3) |
7.6 (45.7) |
5.0 (41.0) |
11.7 (53.1) |
| Mean daily minimum °C (°F) | −1.3 (29.7) |
−0.2 (31.6) |
1.8 (35.2) |
3.7 (38.7) |
8.1 (46.6) |
11.5 (52.7) |
13.5 (56.3) |
13.6 (56.5) |
10.1 (50.2) |
6.3 (43.3) |
1.9 (35.4) |
−0.3 (31.5) |
5.8 (42.4) |
| Record low °C (°F) | −19.0 (−2.2) |
−10.0 (14.0) |
−7.5 (18.5) |
−3.5 (25.7) |
−0.5 (31.1) |
3.0 (37.4) |
6.0 (42.8) |
5.0 (41.0) |
1.0 (33.8) |
−3.5 (25.7) |
−10.5 (13.1) |
−11.0 (12.2) |
−19.0 (−2.2) |
| Average precipitation mm (inches) | 63.5 (2.50) |
45.1 (1.78) |
55.6 (2.19) |
81.4 (3.20) |
84.2 (3.31) |
60.9 (2.40) |
52.2 (2.06) |
56.5 (2.22) |
60.3 (2.37) |
59.0 (2.32) |
65.5 (2.58) |
61.7 (2.43) |
745.9 (29.37) |
| Average precipitation days (≥ 1.0 mm) | 9.0 | 7.5 | 8.5 | 10.4 | 10.6 | 7.6 | 5.9 | 7.5 | 7.6 | 8.6 | 9.0 | 9.2 | 101.4 |
| Source: Météo-France[3] | |||||||||||||
Population
[edit]| Year | Pop. | ±% |
|---|---|---|
| 1962 | 896 | — |
| 1968 | 1,000 | +11.6% |
| 1975 | 1,177 | +17.7% |
| 1982 | 1,195 | +1.5% |
| 1990 | 1,198 | +0.3% |
| 1999 | 1,152 | −3.8% |
| 2008 | 1,324 | +14.9% |
Gallery
[edit]-
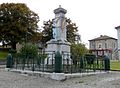 Monument to the dead
 -
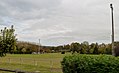 Sports fields
 -

-
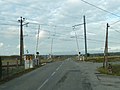 Rail tracks
 -
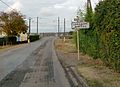 Commune exit


See also
[edit]Communes of the Haute-Garonne department
References
[edit]- ^ "Répertoire national des élus: les maires" (in French). data.gouv.fr, Plateforme ouverte des données publiques françaises. 13 September 2022.
- ^ "Populations légales 2021" (in French). The National Institute of Statistics and Economic Studies. 28 December 2023.
- ^ "Fiche Climatologique Statistiques 1991-2020 et records" (PDF). Météo-France. Retrieved 21 August 2022.
| Authority control databases: National |
|---|
This Haute-Garonne geographical article is a stub. You can help Wikipedia by expanding it. |